The paper discusses the developed online system that is capable of capturing idle time and production data automatically, using signals and data captured from Programmable Logic Controller (PLC) at wire-drawing machines. In addition, the paper focuses on the possibility of generating extremely useful information, using the auto-captured machine data, in the form of spool-wise reports, size-wise reports, production trend graphs, delay analysis graphs and machine status graphs.
Discrepancy in delay and production information leads to a number of hidden delays and hidden loss of production, which may not be worked out to eliminate hidden delays and hidden production losses. Up till now the manual capturing of delays led to a lot of inaccuracy and many losses were left unknown. No online system has been in place for automatic capturing of accurate delay details and accurate shift-wise production data. So, work for development and implementation of an online system has been taken up for automated capturing of delay and production details at the selected wire-drawing machines of galvanising and stranding line.
An online system has been put in place for auto-capturing of idle time and production data at wire drawing machines. An overview diagram of the online system is given in figure 1. Auto generation of delay and production report at the selected machines of GI line and LR line is also an important feature of the system. System-captured delay and production data is automatically sent to the Management Information System (MIS) system at the shift end. Spool-wise and size-wise report is also auto generated by the system. The system also provides visualisation tools for monitoring production and effective delay analysis on daily and monthly bases. The system-generated report is automatically sent to the concerned people through mail. Besides, the important people are intimated about the machine delays (>1 hour) through SMS. The system also provides the machine-wise details for every shift graphically. Web reports have also been developed for viewing the system-generated/captured information as graph or report.
Implementation of in-house developed automation solution has saved the cost of installing third-party automation solution (~50 lakhs INR). Putting up an online system has lead to elimination of hidden delays of machine and so, improvement in productivity. The system ensures correct MIS data of delays and production. The system also makes spool- and size-wise data available for any required analysis. The system provides excellent visualisation tools for simplified and effective daily management.
Description of the work done
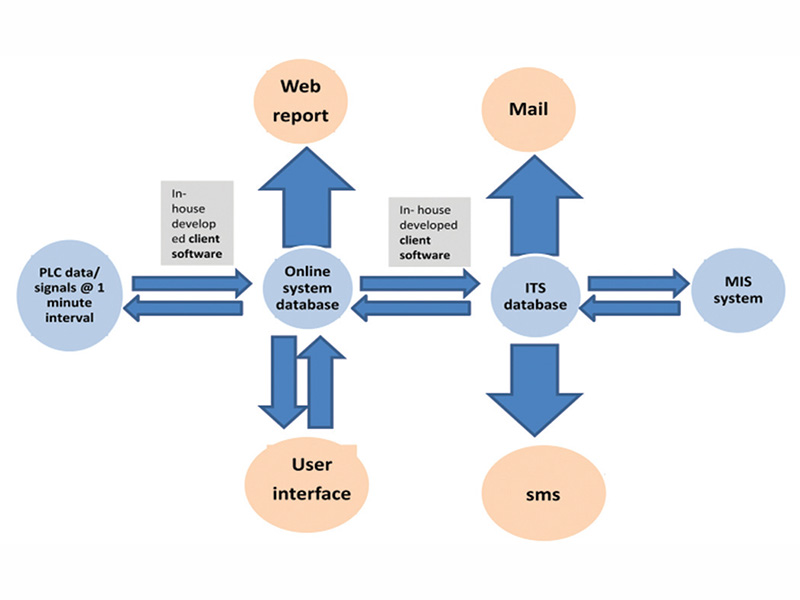
PLC parameters/signals like actual length, set length, actual speed, set speed, running wire size and line running signal are captured and stored in the database of the online system. An online model has been developed for generating the delay start/stop time taking into account the handling time of spool change. Incorporated logic for capturing delay details takes caution to capture accurate details for both short and complete spools. In addition, the system is able to compute online the shift-wise total delay generated on account of running the machine at speed lower than the specified standard speed for each size, except during ramp-up and ramp-down. Facility has been provided to enter the delay reason at the operating panel at machine start.
.
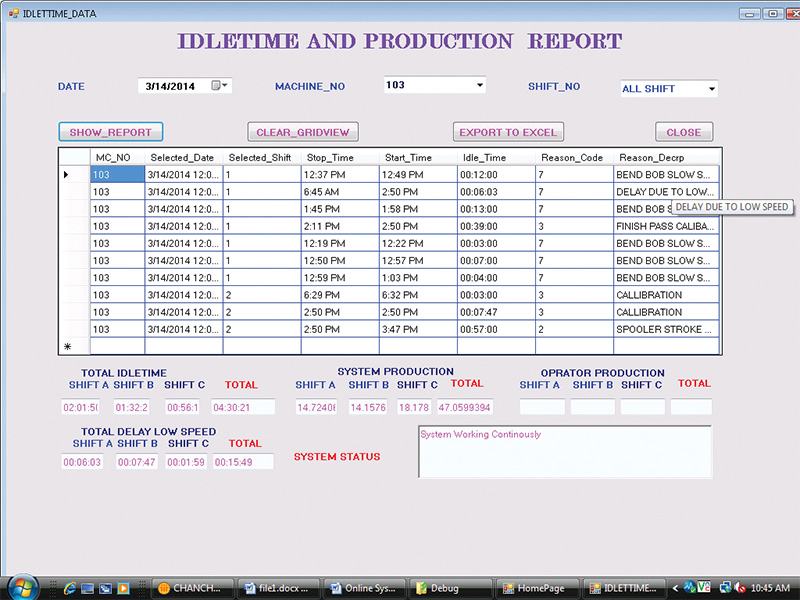
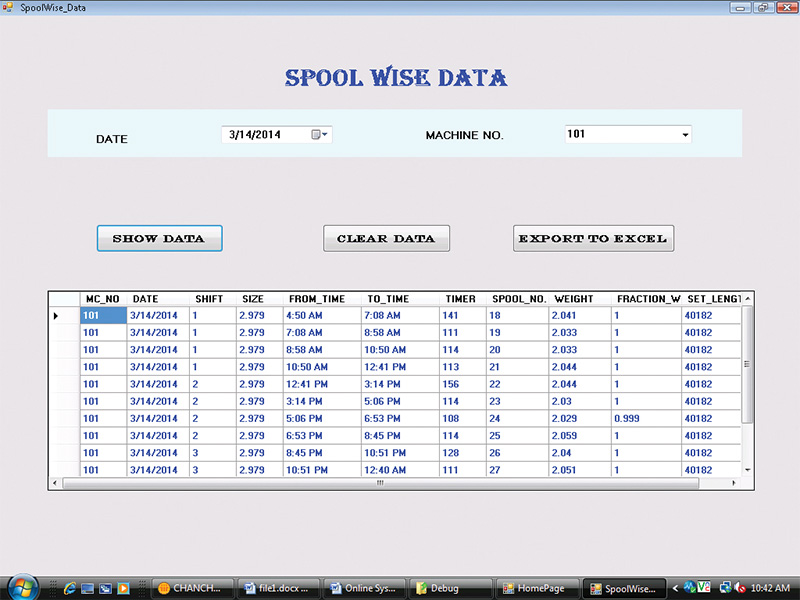
On the other hand, every minute material weight produced is computed by the online system based on online actual speed and actual size. This material weight computed every minute is summed up to generate shift-wise production, spool weight and total tonnage w.r.t. size. System-generated delay and production report, as seen in figure 2, gives the true picture of the line and rules out the possibility of manual errors involved in manually generated report. In addition, the system is capable of storing the minute-to-minute record of important parameters and so has sufficient data in store for any required analysis in future. Spool-wise report, as seen in figure 3, is also generated in the system, where in actual material weight, size and spool fraction (i.e. actual length/set length) and set length are reported. At the line, length is set by the operator to produce target spool weight. Spool-wise report may be used for making required correction in set length to achieve the target weight with spool fraction close to one.
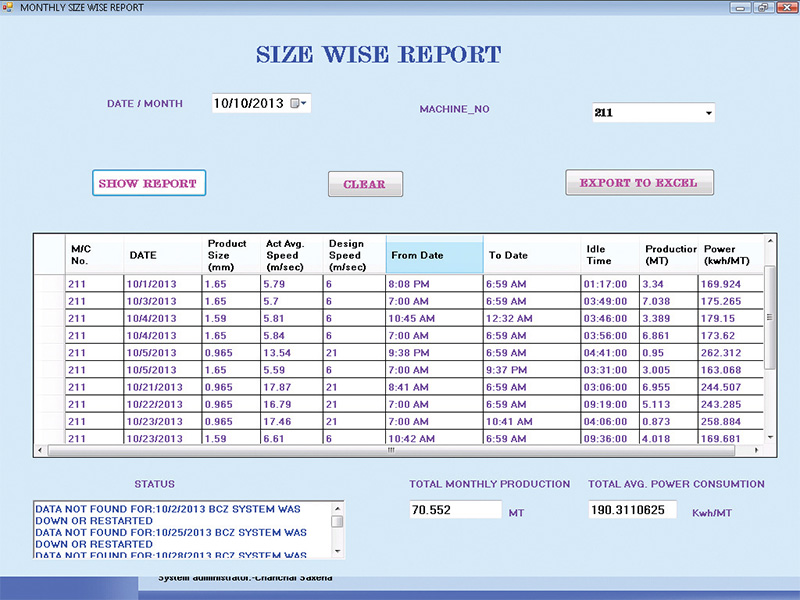
System-generated size-wise report, as seen in figure 4, provides details like the time period when a given size was run, the total idle time during the given period, total production of the given size and total machine power consumed by the size. This report may help in deciding the suitability of running the size on the chosen machine.
System-generated delay and production details are sent to important people through mail. Important people are informed about machine delays (greater than 1 hour) through SMS.
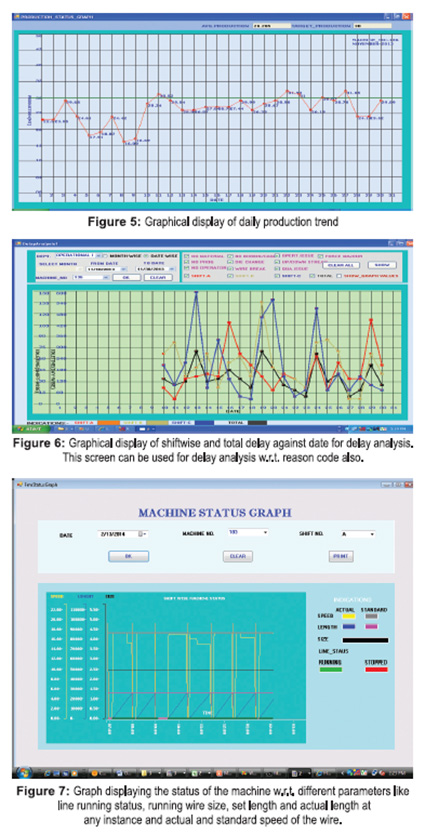
Web reports have been developed for viewing system-generated reports and graphs. User interface has been developed for users to enter delays manually, if a delay is missed out by the system, and also for splitting delays. Screens for viewing production trends, as seen in figure 5, and delay analysis, as seen in figure 6. Figure 7 shows screen for viewing all parameter details in a single screen for selected machine and shift.
Conclusion
Earlier, in the manual recording system, hourly details of running size, approximate weight and delays were noted. With the automated data-capturing system in place, minute-wise recording of actual PLC data has been made possible. Using PLC data/signals, the system is able to accurately generate online the delay and material weight details. In addition, the total delay generated on account of slow speed is captured accurately. Auto-capturing of delays accurately has lead to the elimination of hidden delays, and, therefore, the enhancement of machine productivity. Moreover, the stored MIS data of delay and production is accurate and reliable.
With the simplified data visualisation facility, daily management has been made easy. Evaluation of whether the right size is chosen for a machine and whether the set length is correct is done through a system-generated, spool- and size-wise report.
The developed system has been successfully implemented at all selected machines in the wire plant. The information provided by the system is being well utilised by the users from the operations department. In-house development of the system saved the cost of third-party software installation. In addition, it is possible to deploy similar systems at all other machines in all wire plants under Tata Steel Global Wires. n
This article has been written by Ms. Chanchal
Saxena, Mr. Sudhir Malavade, Mr. Lalit Paymode,
Mr. P. Ragupathy, Mr. Sanjay Kosambi and Mr. D. H. Patil.


