Until recently, measuring systems used to determine the surface quality of products inline during the process were almost exclusively deployed for process control. Process variables were measured, compared with target values and the settings of the production plant were optimized with the deviations determined. But in times of BIG DATA and Industry 4.0, this is often no longer sufficient. The quality of production processes should not only be regulated, but also analysed and documented.
As a manufacturer of rolling mills, FUHR is constantly being challenged by increasing demands on the finished wire’s geometric precision. Accuracies of class 6 according to ISO 386 are almost standard. This implies a permissible deviation of +1- 0.0030 mm for small profile wires with a nominal diameter of up to 3 mm. If a process capability (Cp or Cpk) is also required, a spread of only +1- 0.0015 mm remains in production.
In order to ensure that these requirements are met in daily production, the wire must be continuously measured whilst exiting the rolling mill and the roll positions must be adjusted fully automatically. In multi-stage rolling processes it is necessary to measure and calibrate right after the pre-rolling stages. Therefore, modern high-speed rolling mills made by FUHR are equipped with several measuring systems.
Conventional laser shadow measurement systems, as typically used in drawing round wires, have not proven to be successful in profiling lines. On the one hand, even a slight tilting of the wire changes the size of the shadow. On the other hand, laser systems cannot be used permanently in the wet area of the pre-rolling stages.
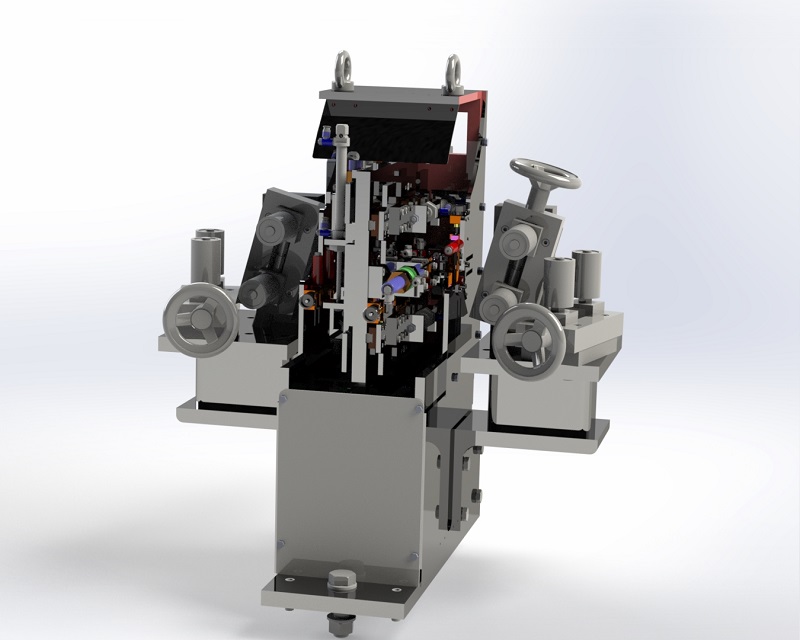
FUHR therefore relies on tactile measuring systems, in which the wire is scanned with diamond-studded, high-resolution displacement measuring systems.
Alternatively, instead of diamond styli, stylus rollers especially adapted to the wire geometry are available.
These measuring systems have been developed and built by FUHR for several years. They are characterized by precision, robustness and a particularly good value-for money. As a result, it is now possible and common practice to integrate more than just one of these systems into a rolling mill.
FUHR uses these systems in new machines, but also supplies them for existing and third-party plants. In particular, retrofitting measuring devices that are no longer supported by the manufacturer offers a financial added value: on the one hand, running existing measuring technology does not have to be replaced by new technology, and on the other hand, systems of different origins can be monitored with one visual output module.

In order to be able to fulfill the customer requirements for data analysis and quality documentation mentioned at the beginning of this article, FUHR has now brought its data acquisition and evaluation system F-MAS to market maturity. It is available as an additional option to the tactile measuring systems but can also be retrofitted to existing digital or analogue measuring systems. During its development, special attention was paid to compatibility with third-party systems – particularly with regards to integration into existing systems.
With F-MAS, two wire dimensions (e.g. width and thickness of a rectangular profile) are measured with a measuring frequency of 1000 Hz. This real data is displayed in diagrams, statistical values are calculated, and frequency distributions are displayed. Reports are generated and raw data is exported. Integration into customer networks is a matter of course. Data export to standard data analysis software is possible via an OPC-UA interface.
Also integrated is an FFT analysis, which detects cyclical dimensional fluctuations. Thus, for example, the concentricity error of a roller or the defect of a bearing or gearbox is reliably unmasked as the cause of a quality problem based on the frequency of occurrence of the error.


